Geospatial Risk Monitoring Experience
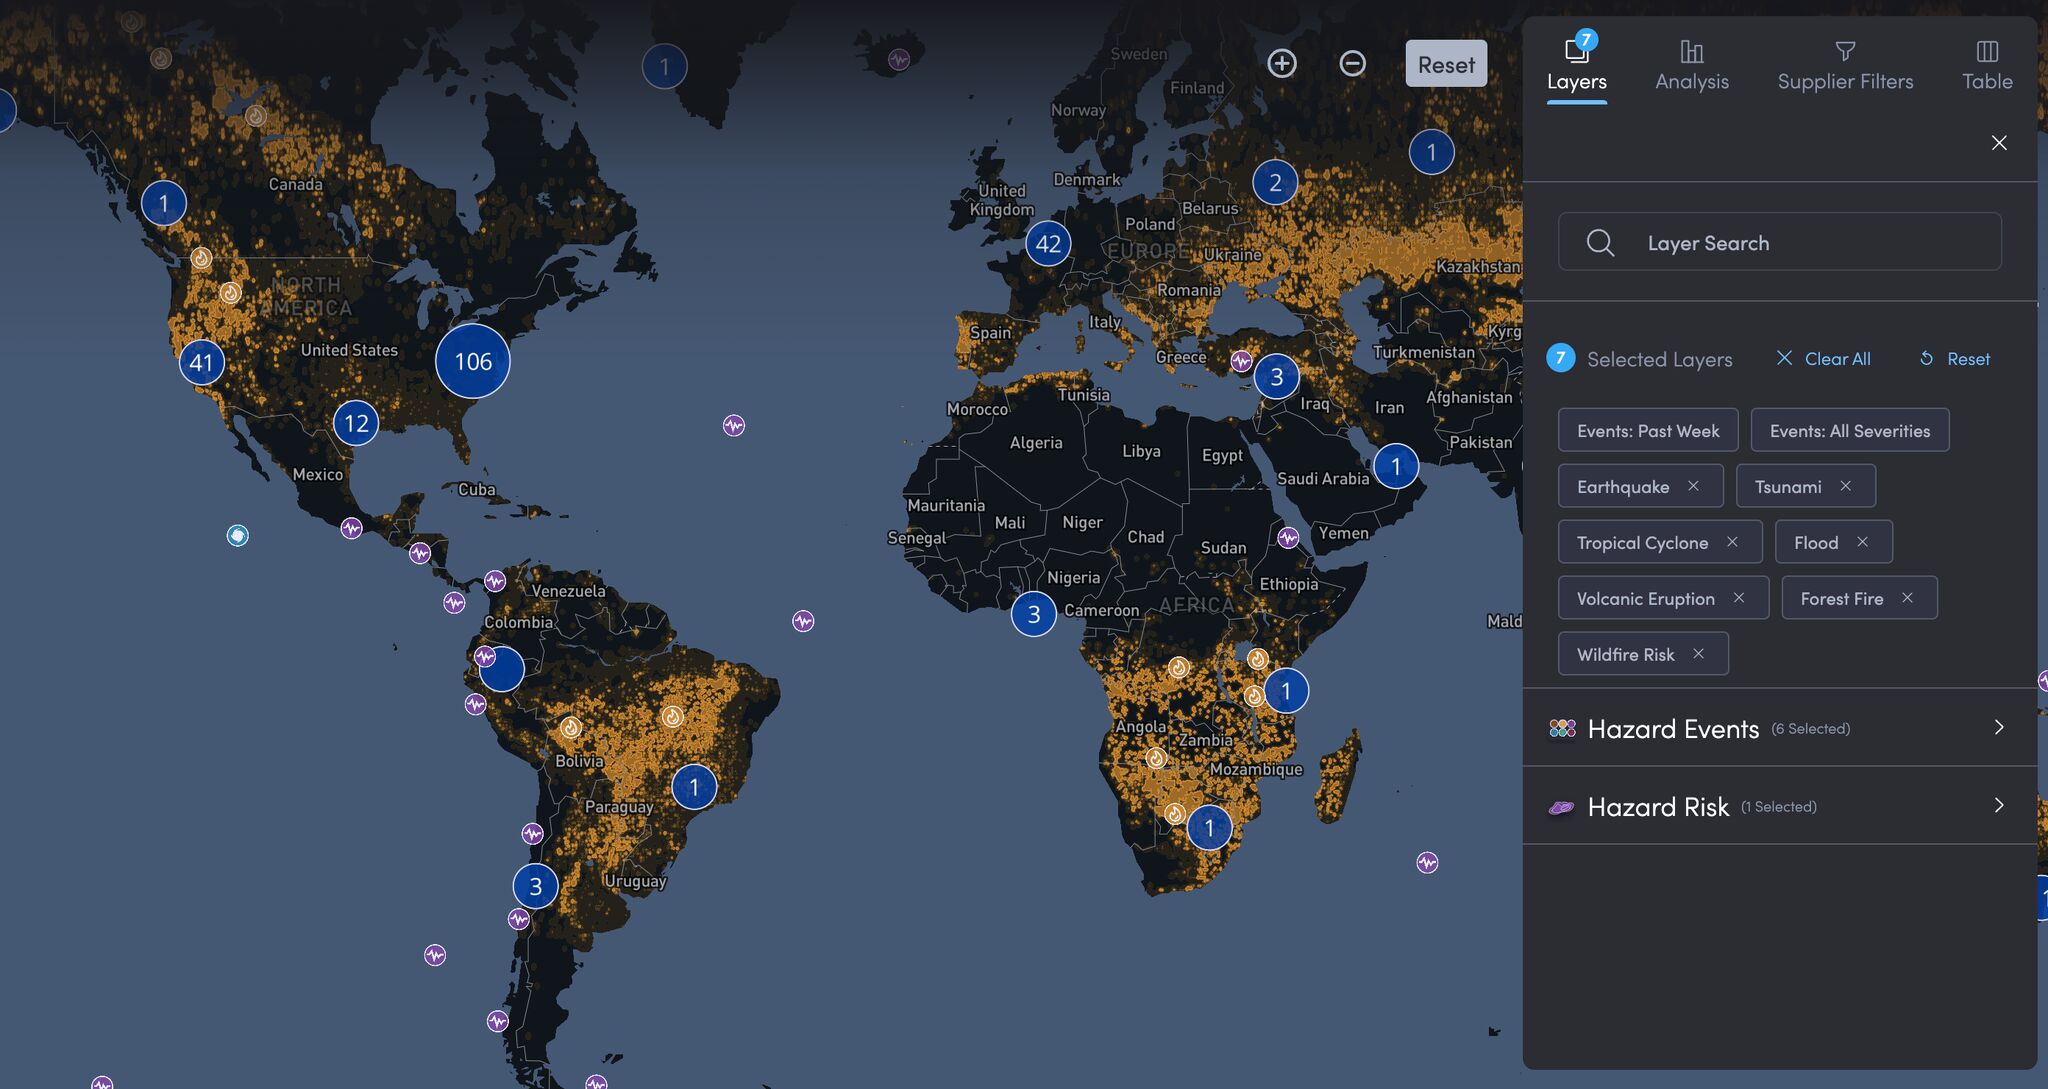
At my current company, an innovative supply chain startup, my team and I developed a geospatial risk exploration experience that enables companies to track and monitor risks within their suppliers.
Project Importance:
In a time of increased climate-caused catastrophes, this map and associated sub-visualizations provides companies with a way of anticipating potential future disasters that not only have devastating human impact but financial impact.
Design, Prototyping and Data Modeling:
I served as the senior designer and visualization engineer on this project, closely collaborating with our design director and engineering team. Drawing on my spatial data experience, I was involved at every stage.
My team prioritized UX research for accessibility and feedback, and I co-built a custom CI/CD demo environment to support both engineering and design.
For the prototype, I used Maplibre, Mapbox, React, and Typescript, while developing a Python script to prep data from our methodology team for visualization.
User Research and Production Build:
After we tested the prototype on customers and made modifications based on that user research, our engineering team and I used the foundation I built to scale into our production environment.
In the end we moved away from Mapbox and only used Maplibre for cost and flexibility and moved to PostGIS and S3 to host our map layers and shapes.
User Interface: Supplementary visualizations and config in the sidebar.
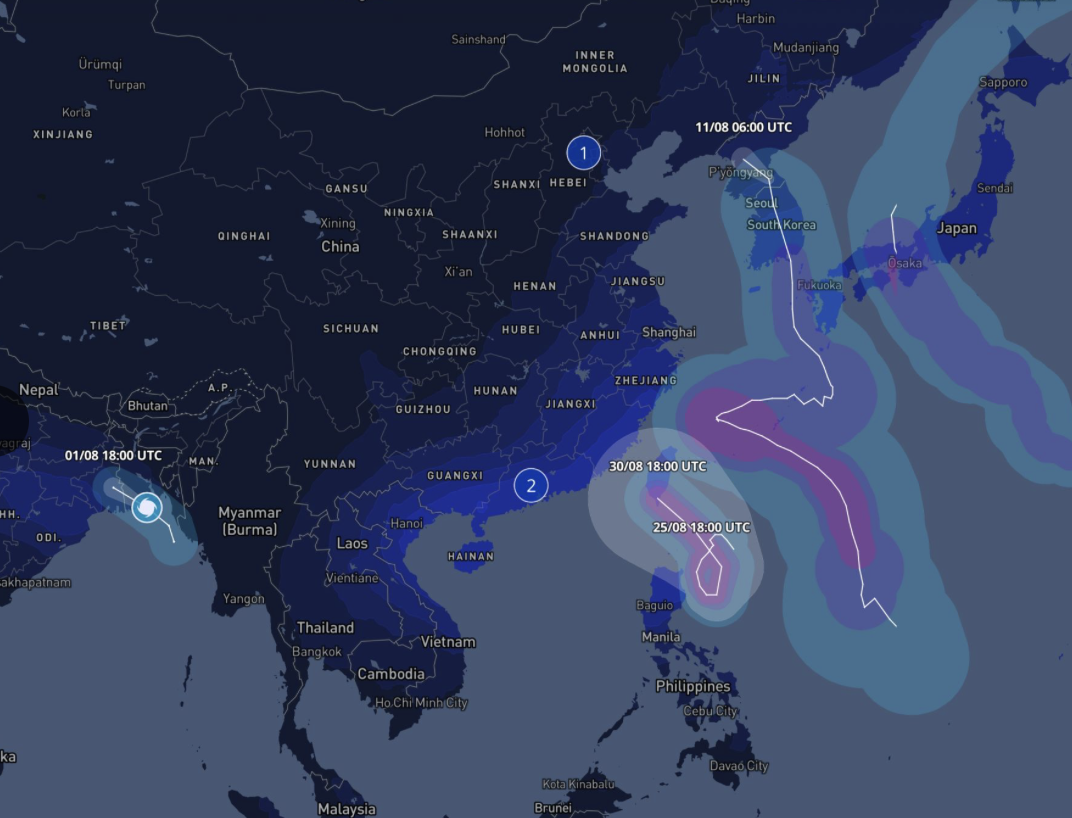
Clearly Defined Event Impact Zones:
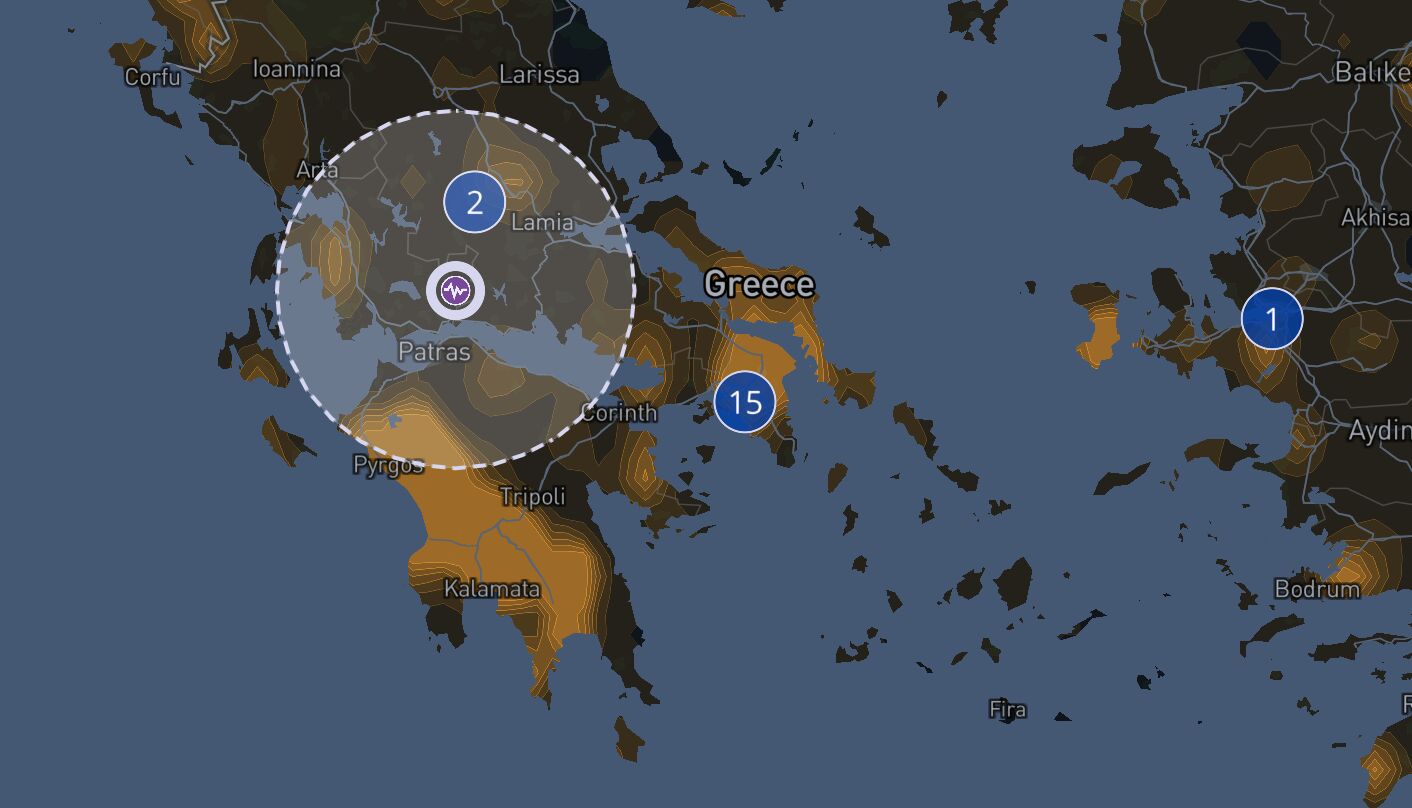
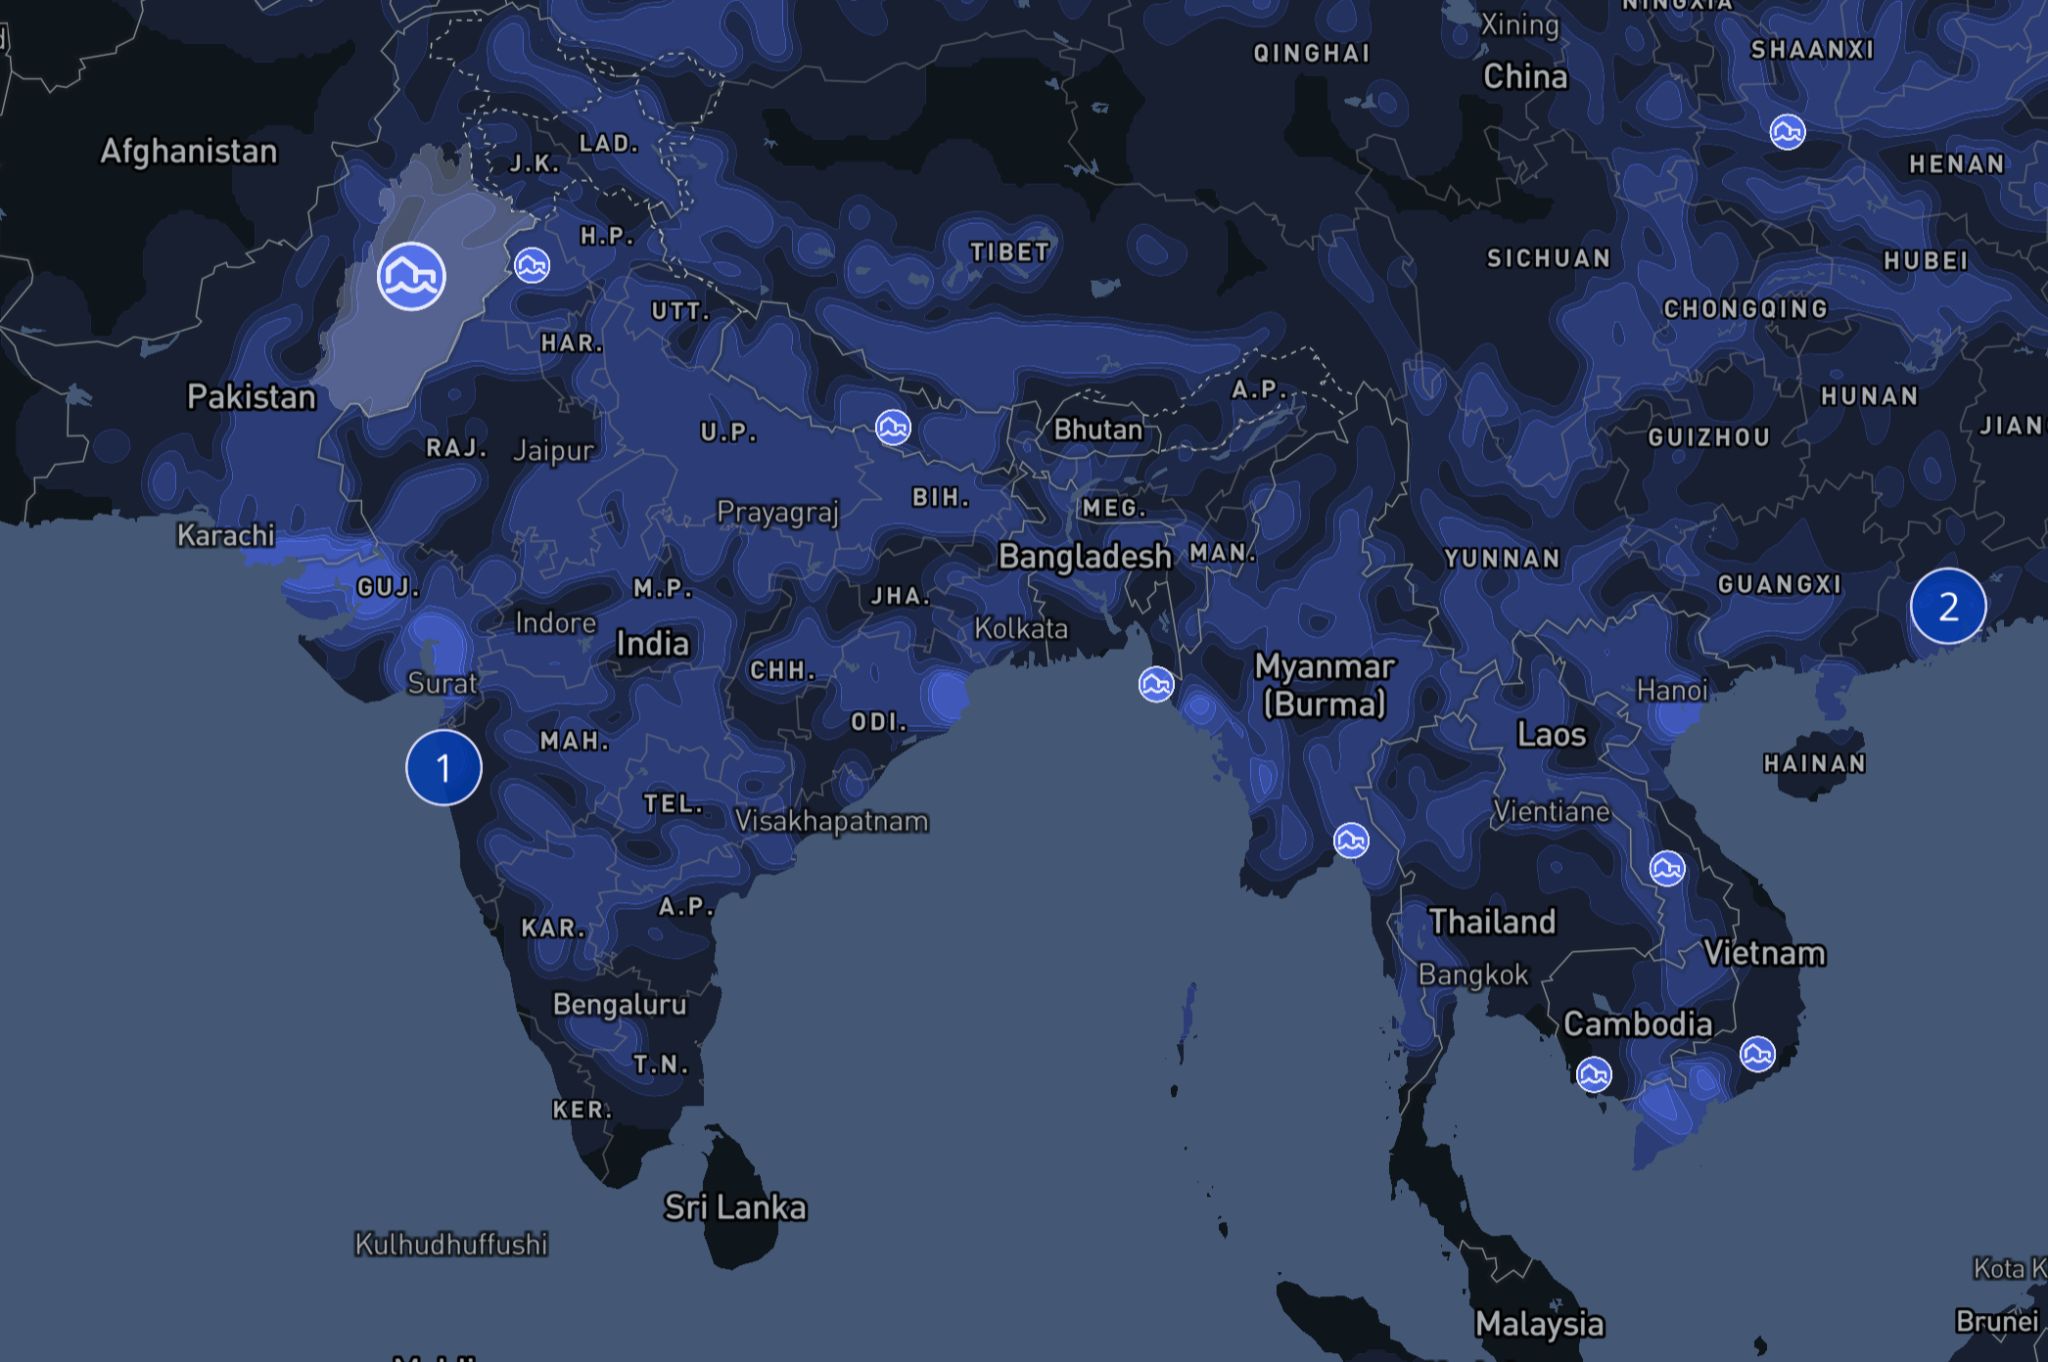
Risk layering: Color was reinforced with Iconography and tables for accessibility.
Not shown:
- All visuals were backed up with a table for accessibility.
- Motion is essential to understanding map context.
- All events clearly showed impact so users were able to get the information they needed quickly.